A VISUAL INVESTIGATION
Record spending tells us how much money moved. It does not tell us who could afford it, or how much of the
decision belonged to the person paying.
U.S. data · Editorial update November 19, 2026 · Reading time: 15 minutes
History, the sales pitch, spending, debt, and practical ways to choose your own Friday.
Actuals and 2026 forecasts are labeled. Dollar figures are not adjusted for inflation. Check
the evidence ↓ · Go straight to the alternatives
↓
01 / HOW A TRAFFIC PROBLEM BECAME A
TRADITION
Before the doorbusters, there was the traffic.
The day after Thanksgiving became “Black Friday” in Philadelphia police usage in the 1950s and 1960s: crowds
of shoppers and visitors arriving ahead of the Army–Navy football game meant congestion, disorder and long
shifts. The familiar explanation that retailers suddenly move from losses “in the red” to profits “in the
black” came later, as a friendlier sales pitch. It is not the original shopping-related meaning. [17]
Retailers turned the occasion into a national promotion, then a longer season of early deals,
Thanksgiving-weekend sales and Cyber Monday offers. The shopping event spread beyond the United States, even
to countries that do not celebrate American Thanksgiving. What started as one difficult Friday now follows the
customer through stores, phones and weeks of advertising.
01 / THE NUMBERS
The biggest day keeps getting bigger.
In 2025, shoppers spent $11.8 billion online on Black Friday. Adobe expects another record in 2026: $12.9
billion. That would be about 32% above 2023.
Black Friday online spending
USD billions
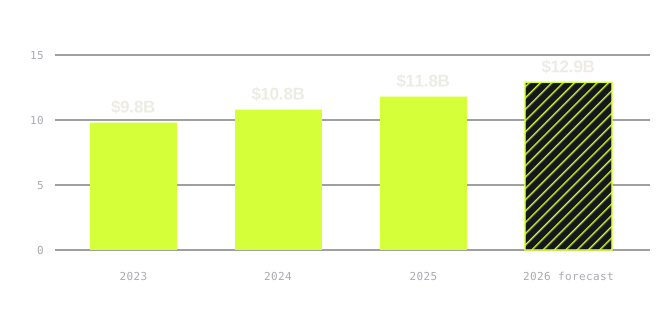
Online purchases only. Physical-store sales are excluded. The 2026 figure is a forecast.
View data table
| Year |
Amount |
Status |
| 2023 |
$9.8B |
Actual |
| 2024 |
$10.8B |
Actual |
| 2025 |
$11.8B |
Actual |
| 2026 forecast |
$12.9B |
Forecast |
02 / THE NUMBERS
One Friday. Two months of checkout.
The online holiday season passed a quarter of a trillion dollars in 2025. Adobe projects $275.1 billion for
2026, with Cyber Week accounting for just 17.3% of the total.
November–December online spending
USD billions
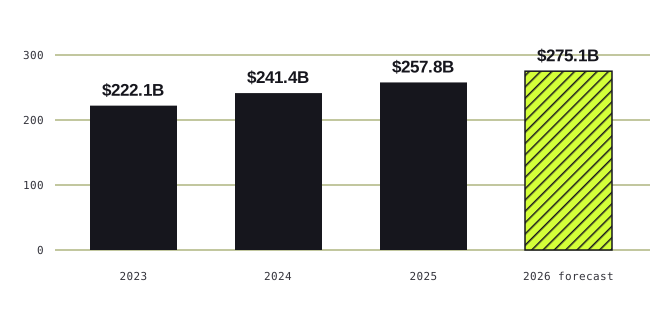
November 1–December 31 each year. Nominal dollars; not adjusted for inflation.
View data table
| Year |
Amount |
Status |
| 2023 |
$222.1B |
Actual |
| 2024 |
$241.4B |
Actual |
| 2025 |
$257.8B |
Actual |
| 2026 forecast |
$275.1B |
Forecast |
03 / THE LONG AFTER THE WEEKEND
Your purchase lasts only a moment, but the debt obligation can last years.
The New York Fed’s Q2 2026 report puts household debt at $18.77 trillion,
including $1.26 trillion on credit cards. It reports 4.7% of outstanding debt
in some stage of delinquency. Those are economy-wide balances, not a bill for this holiday season. [9]
01 / LESS ROOM
Next month’s paycheck is already spoken for.
Principal, interest and fees leave less money for saving and the next emergency. Borrowing can smooth a
temporary shortfall; repeatedly borrowing to cover necessities can leave a household with less room to
recover.
02 / A LONGER RECOVERY
Falling behind reaches beyond one purchase.
Missed payments can damage a credit record and make future borrowing harder or more expensive. An income
shock can become a longer setback when a household must rebuild both savings and access to credit.
03 / UNEVEN PRESSURE
The "average" household is not every household.
High aggregate spending can coexist with distress among people with smaller income and cash buffers. A
national debt total does not tell us who can comfortably pay, who pays in full, or who keeps rolling a
balance.
04 / A WIDER RETREAT
Private cutbacks become public consequences.
If enough households cut purchases at once, businesses can lose revenue and reduce hiring. Rising loan
losses can tighten credit, adding pressure to borrowers and employers. That is a possible transmission
mechanism, not proof that a financial crisis is underway.
ANTIcomputer analysis of the debt and financial-stability evidence. The Federal Reserve’s May 2026
assessment describes aggregate debt vulnerabilities as moderate and household balance sheets as strong overall,
alongside elevated card and auto delinquency. A large nominal debt total alone is not a crash forecast. [21] [12]
03 / THE NUMBERS
The balance keeps going.
Credit card balances reached $1.26 trillion in Q2 2026, $54 billion higher than a year earlier. A completed
transaction is not necessarily a completed payment.
Update: the New York Fed’s Q3 2026 report, released November 10, puts card balances at $1.29 trillion, $52
billion higher than a year earlier. Total household debt reached $19.11 trillion, with 5.0% of debt in some
stage of delinquency. [24]
U.S. credit card balances · Q2 each year
USD trillions
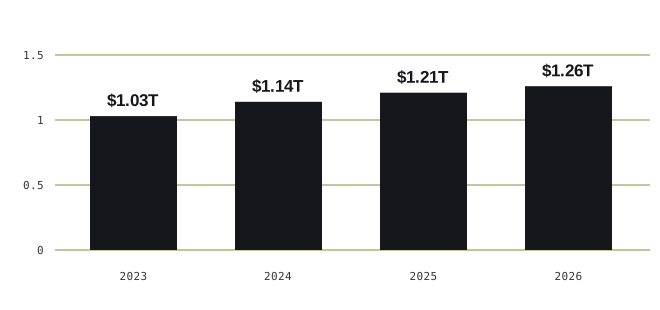
Rounded to $0.01 trillion. Same-quarter snapshots reduce seasonal distortion. Includes balances
later paid in full; covers all purchases, not just holiday shopping.
View data table
| Year |
Amount |
Status |
| 2023 |
$1.03T |
Actual |
| 2024 |
$1.14T |
Actual |
| 2025 |
$1.21T |
Actual |
| 2026 |
$1.26T |
Actual |
04 / THE NUMBERS
Four payments. One more purchase.
Buy now, pay later financed $20 billion in online holiday purchases in 2025. Adobe expects $21.3 billion in
2026, including $807 million on Black Friday alone.
Holiday purchases made using buy now, pay later
USD billions
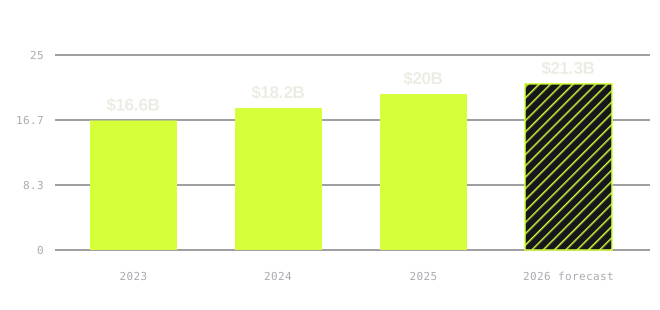
Purchase volume through BNPL, not outstanding loan balances or defaults. BNPL share of holiday
online spending was approximately 7.5% in 2023 and 7.8% in 2025 (calculated).
View data table
| Year |
Amount |
Status |
| 2023 |
$16.6B |
Actual |
| 2024 |
$18.2B |
Actual |
| 2025 |
$20B |
Actual |
| 2026 forecast |
$21.3B |
Forecast |
THE ALTERNATIVES / YOU CAN CHOOSE A
DIFFERENT FRIDAY
Buy with a purpose. Or don’t buy at all.
Start with the life you already have: what needs replacing, what can be repaired, and what
you would rather do with the day. Set the budget and the purpose before the retailer sets the deadline.
01
Buy local.
Start with independent shops, secondhand stores and makers in your community. If you already plan to buy a
book, a gift or something for your home, give a nearby business a place on your comparison list.
Set the budget before you walk in. Ask about the product, compare the total price and check the return
policy. Shopping locally is a choice about where to spend; it is not a reason to spend beyond your means.
Try this: a short list, a fixed budget, one local stop.
02
Buy used or refurbished.
Look for the function you need rather than the newest model. Used books, furniture and tools—and
refurbished electronics—give you alternatives to buying everything new.
Compare condition and total cost, not just the headline discount. For electronics, check battery condition,
remaining software support, included accessories, warranty and return terms. “Refurbished” is not a
universal quality grade. Read what this particular seller promises. [22]
Try this: price the same need three ways—new, used and refurbished.
03
Spend the day differently.
Stay home, make a meal, read a book, repair something, take a walk or see someone you care about. A useful
or enjoyable day does not have to produce a receipt.
Staying out of the stores works best when you also step away from the digital checkout. Mute promotional
alerts, close the shopping tabs and leave an unplanned purchase for another day.
Try this: a day
without a checkout, online or off.
Make the decision yours.
- Would I want this without the sale sign, the countdown or the promise of an upgrade to my identity?
- Does it fit my budget after essentials and existing payments?
- Do I already own, or could I borrow, something that does the job?
- What is the total price, including fees, delivery and any financing costs?
A useful discount lowers the cost of something you chose deliberately. You can also borrow it, repair it,
postpone it or decide that what you have is enough. Keeping your money and your time is a complete outcome.
These are editorial alternatives, not promises that every local or secondhand purchase is cheaper.
The FTC recommends comparing total costs, reading product descriptions and checking return terms. [22]